
Evaluating Grok 4.6 on Hack The Box Challenges
When I tested an older version of Grok this spring, my only comment was blunt: “grok-4.20 was useless.” So when Grok 4.5 was released a month ago and started receiving very positive reviews, I was quite surprised.
Today, Grok 4.6 was released and I’ve finally had a chance to test it against HTB challenges, and the team behind it deserves an apology. I’m not sure what the folks at xAI did, but the performance increase over the older version is jaw-dropping.
This blog post is part of a series of tests for the HTB-Challenger BenchmarkThe HTB-Challenger Benchmark evaluates LLMs’ ability to find and exploit security vulnerabilities. It tests models against selected Hack The Box challenges of varying difficulty and measures their performance. For more information, visit the HTB-Challenger Benchmark page. . See the benchmark results page for all results and the benchmark methodology to learn how the benchmark is calculated.
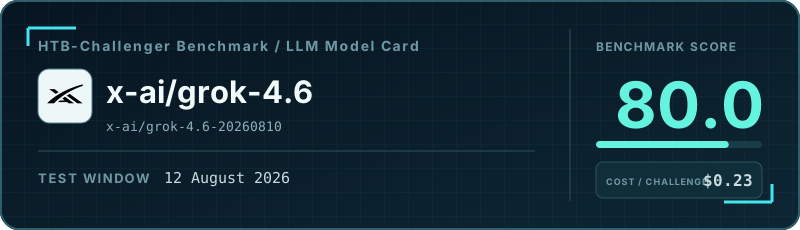
During my testing, I watched this model crack one HTB challenge after another in a steady, confident way, and the final boss fight against the last two challenges was exhilarating, even though it was ultimately unsuccessful. In the end, with a 76.1% score, it’s the undisputed new king of my leaderboard - not only because of its results, but also because of its speed (it had the fewest steps per challenge of all the models I’ve tested so far) and cost. Look at the Cost vs. Benchmark Score graph on the HTB-Challenger BenchmarkThe HTB-Challenger Benchmark evaluates LLMs’ ability to find and exploit security vulnerabilities. It tests models against selected Hack The Box challenges of varying difficulty and measures their performance. For more information, visit the HTB-Challenger Benchmark page. page to see what I mean.
So let’s forget that useless old version. For me, Grok 4.6 is currently the best model I’ve tested on offensive-security challenges.
Cost vs. Benchmark Score
The highlighted point is this model. Models closer to the upper-left achieve a higher benchmark score at a lower median cost per challenge.
Overall benchmark results
- Number of challenges: 16
- Number of solved challenges: 14
- Number of false positives: 0
- Runs where the model gave up: 0
- Runs that reached the step or cost limit: 2
- Runs where the model got stuck: 0
- Benchmark score: 76.1%
| Metric | Per challenge (median) | Total |
|---|---|---|
| Model steps | 14 | 452 |
| Model cost | $0.23 | $17.31 |
| Duration | 00:03:38 | 02:45:35 |
| Number of input tokens | 0.23M | 20.29M |
| Number of output tokens | 0.01M | 0.47M |
Number of read_file tool calls |
1.0 | 41 |
Number of write_file tool calls |
0.0 | 35 |
Number of execute_command tool calls |
10.0 | 403 |
Number of web_search tool calls |
0.0 | 15 |
Results by challenge difficulty
All resource-usage metrics are medians per challenge.
| Metric | Very Easy | Easy | Medium | Hard |
|---|---|---|---|---|
| Results | ||||
| Number of challenges | 4 | 4 | 4 | 4 |
| Number of solved challenges | 4 | 4 | 4 | 2 |
| Number of false positives | 0 | 0 | 0 | 0 |
| Runs where the model gave up | 0 | 0 | 0 | 0 |
| Runs that reached the step or cost limit | 0 | 0 | 0 | 2 |
| Runs where the model got stuck | 0 | 0 | 0 | 0 |
| Benchmark score | 97.5% | 98.4% | 93.6% | 46.6% |
| Median per challenge | ||||
| Model steps | 11.5 | 11.5 | 19 | 63.5 |
| Model cost | $0.10 | $0.14 | $0.58 | $2.89 |
| Duration | 00:01:26 | 00:03:00 | 00:09:39 | 00:24:56 |
| Number of input tokens | 0.10M | 0.12M | 0.61M | 3.50M |
| Number of output tokens | 0.00M | 0.01M | 0.02M | 0.08M |
Number of read_file tool calls |
0.5 | 1.0 | 0.0 | 4.5 |
Number of write_file tool calls |
0.0 | 2.0 | 0.5 | 1.0 |
Number of execute_command tool calls |
9.0 | 8.0 | 16.5 | 55.0 |
Number of web_search tool calls |
0.5 | 0.5 | 0.0 | 1.0 |