
Evaluating Muse Spark 1.2 on Hack The Box Challenges
I have to admit something: I have opinions. That’s not exactly a character flaw, but mixing opinions with facts and hard data is rarely a good idea. Sometimes, though, keeping the two separate is difficult.
Like now.
Meta is back, this time with Muse Spark 1.2, an ambitious new model. Unfortunately, I have strong opinions about Meta and its business model, and I would rather not risk letting those opinions color my usual discussion of the test results. So this time, I’ve decided not to offer any commentary. Here are the hard numbers from my testing. I’ll leave the interpretation to you.
This blog post is part of a series of tests for the HTB-Challenger BenchmarkThe HTB-Challenger Benchmark evaluates LLMs’ ability to find and exploit security vulnerabilities. It tests models against selected Hack The Box challenges of varying difficulty and measures their performance. For more information, visit the HTB-Challenger Benchmark page. . See the benchmark results page for all results and the benchmark methodology to learn how the benchmark is calculated.

Cost vs. Benchmark Score
The highlighted point is this model. Models closer to the upper-left achieve a higher benchmark score at a lower median cost per challenge.
Overall benchmark results
- Number of challenges: 16
- Number of solved challenges: 11
- Number of false positives: 0
- Runs where the model gave up: 1
- Runs that reached the step or cost limit: 3
- Runs where the model got stuck: 1
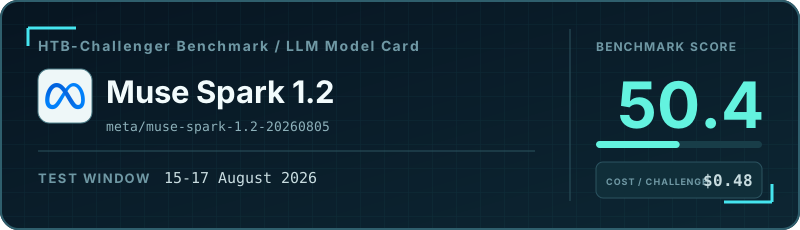
- Benchmark score: 50.4%
| Metric | Per challenge (median) | Total |
|---|---|---|
| Model steps | 32 | 723 |
| Model cost | $0.48 | $12.66 |
| Duration | 00:05:36 | 02:21:52 |
| Number of input tokens | 0.96M | 25.86M |
| Number of output tokens | 0.03M | 1.15M |
Number of read_file tool calls |
1.0 | 44 |
Number of write_file tool calls |
0.0 | 1 |
Number of execute_command tool calls |
29.0 | 667 |
Number of web_search tool calls |
0.0 | 14 |
Results by challenge difficulty
All resource-usage metrics are medians per challenge.
| Metric | Very Easy | Easy | Medium | Hard |
|---|---|---|---|---|
| Results | ||||
| Number of challenges | 4 | 4 | 4 | 4 |
| Number of solved challenges | 4 | 4 | 2 | 1 |
| Number of false positives | 0 | 0 | 0 | 0 |
| Runs where the model gave up | 0 | 0 | 0 | 1 |
| Runs that reached the step or cost limit | 0 | 0 | 2 | 1 |
| Runs where the model got stuck | 0 | 0 | 0 | 1 |
| Benchmark score | 94.3% | 94.8% | 49.3% | 18.1% |
| Median per challenge | ||||
| Model steps | 22 | 22.5 | 55.5 | 96.5 |
| Model cost | $0.22 | $0.18 | $0.89 | $1.79 |
| Duration | 00:02:36 | 00:05:36 | 00:08:19 | 00:20:31 |
| Number of input tokens | 0.58M | 0.36M | 1.80M | 3.73M |
| Number of output tokens | 0.01M | 0.02M | 0.06M | 0.14M |
Number of read_file tool calls |
0.5 | 1.0 | 0.5 | 0.5 |
Number of write_file tool calls |
0.0 | 0.0 | 0.0 | 0.0 |
Number of execute_command tool calls |
18.0 | 18.5 | 48.5 | 92.0 |
Number of web_search tool calls |
1.0 | 0.5 | 0.0 | 0.5 |