
Evaluating Kimi K3 on Hack The Box Challenges
Kimi K3 landed with a big splash just three weeks ago, and the initial reviewers seemed to agree on one thing: it’s very good, but it’s also quite expensive. So here I am, the late reviewer, with my own numbers. Let’s see if they line up with the prevailing opinion.
This blog post is part of a series of tests for the HTB-Challenger BenchmarkThe HTB-Challenger Benchmark evaluates LLMs’ ability to find and exploit security vulnerabilities. It tests models against selected Hack The Box challenges of varying difficulty and measures their performance. For more information, visit the HTB-Challenger Benchmark page. . See the benchmark results page for all results and the benchmark methodology to learn how the benchmark is calculated.

In short, my numbers line up pretty well with what you may have already read or heard about Kimi K3.
So far, I can compare it only with GPT-5.6 Luna and GPT-5.6 Luna Pro, and the difference is clear. Kimi K3 achieved an XP-weighted benchmark score of 70.7%, well ahead of Luna at 31.6% and Luna Pro at 51.3%. That was more or less what I expected based on the initial reviews.
The difference also shows up where it matters for harder offensive-security tasks. Kimi K3 solved all four Medium challenges and two of the four Hard ones. Luna Pro solved two Medium challenges and one Hard challenge, while Luna solved only one Medium challenge and no Hard challenges.
But that extra capability is costly. Based on the median model cost per challenge, Kimi K3 was almost five times more expensive than GPT-5.6 Luna Pro and about 23 times more expensive than GPT-5.6 Luna.
Anyway, if your budget is not tight and you need a high-performance model for offensive-security or CTF-style tasks, Kimi K3 is the strongest of the three models I have tested so far.
Cost vs. Benchmark Score
The highlighted point is this model. Models closer to the upper-left achieve a higher benchmark score at a lower median cost per challenge.
Overall benchmark results
- Number of challenges: 16
- Number of solved challenges: 13
- Number of false positives: 0
- Runs where the model gave up: 1
- Runs that reached the step or cost limit: 2
- Runs where the model got stuck: 0
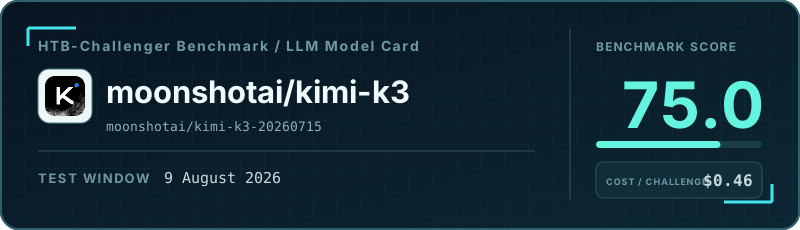
- Benchmark score: 70.7%
| Metric | Per challenge (median) | Total |
|---|---|---|
| Model steps | 22 | 573 |
| Model cost | $0.46 | $30.56 |
| Duration | 00:07:34 | 05:37:40 |
| Number of input tokens | 0.33M | 18.77M |
| Number of output tokens | 0.02M | 0.66M |
Number of read_file tool calls |
1.0 | 41 |
Number of write_file tool calls |
3.5 | 62 |
Number of execute_command tool calls |
15.5 | 520 |
Number of web_search tool calls |
0.0 | 3 |
Results by challenge difficulty
All resource-usage metrics are medians per challenge.
| Metric | Very Easy | Easy | Medium | Hard |
|---|---|---|---|---|
| Results | ||||
| Number of challenges | 4 | 4 | 4 | 4 |
| Number of solved challenges | 4 | 3 | 4 | 2 |
| Number of false positives | 0 | 0 | 0 | 0 |
| Runs where the model gave up | 0 | 0 | 0 | 1 |
| Runs that reached the step or cost limit | 0 | 1 | 0 | 1 |
| Runs where the model got stuck | 0 | 0 | 0 | 0 |
| Benchmark score | 96.6% | 72.6% | 94.0% | 45.7% |
| Median per challenge | ||||
| Model steps | 16.5 | 18.5 | 16.5 | 68 |
| Model cost | $0.43 | $0.44 | $1.42 | $2.39 |
| Duration | 00:04:31 | 00:06:11 | 00:22:12 | 00:17:31 |
| Number of input tokens | 0.15M | 0.28M | 0.39M | 2.59M |
| Number of output tokens | 0.01M | 0.02M | 0.03M | 0.04M |
Number of read_file tool calls |
0.5 | 1.0 | 1.5 | 1.5 |
Number of write_file tool calls |
2.5 | 4.5 | 2.0 | 5.5 |
Number of execute_command tool calls |
9.5 | 13.0 | 15.0 | 62.0 |
Number of web_search tool calls |
0.0 | 0.0 | 0.0 | 0.0 |