
Evaluating DeepSeek V4 Pro on Hack The Box Challenges
DeepSeek V4 Pro was the best (and most expensive) LLM I tested with Strix a few months ago. After the heartbreaking results of its smaller sibling, DeepSeek V4 Flash 0731, in my HTB-Challenger tests, I was curious to see how the Pro version would handle the new challenges.
This blog post is part of a series of tests for the HTB-Challenger BenchmarkThe HTB-Challenger Benchmark evaluates LLMs’ ability to find and exploit security vulnerabilities. It tests models against selected Hack The Box challenges of varying difficulty and measures their performance. For more information, visit the HTB-Challenger Benchmark page. . See the benchmark results page for all results and the benchmark methodology to learn how the benchmark is calculated.

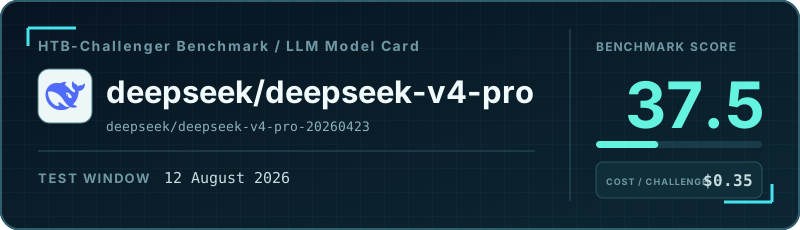
The results of DeepSeek V4 Pro in my testing were, well, not great and not terrible. On the one hand, it didn’t have the basic flaws I observed when testing DeepSeek V4 Flash 0731: it didn’t submit any incorrect flags, and it used the available tools without any issues. On the other hand, its final score was comparable to that of GPT-5.6 Luna, whose median cost per test was 17 times lower.
The performance gap between DeepSeek V4 Pro and the leaders of my benchmark was also quite large. I’m afraid that’s a sign of just how quickly things have progressed over the last few months. DeepSeek V4 Pro was released four months ago, which feels like an eternity now that we’re getting better and better models almost every month.
Cost vs. Benchmark Score
The highlighted point is this model. Models closer to the upper-left achieve a higher benchmark score at a lower median cost per challenge.
Overall benchmark results
- Number of challenges: 16
- Number of solved challenges: 8
- Number of false positives: 0
- Runs where the model gave up: 0
- Runs that reached the step or cost limit: 8
- Runs where the model got stuck: 0
- Benchmark score: 36.2%
| Metric | Per challenge (median) | Total |
|---|---|---|
| Model steps | 62.5 | 938 |
| Model cost | $0.35 | $11.84 |
| Duration | 00:06:19 | 03:34:35 |
| Number of input tokens | 1.93M | 39.64M |
| Number of output tokens | 0.01M | 0.35M |
Number of read_file tool calls |
1.5 | 55 |
Number of write_file tool calls |
1.0 | 92 |
Number of execute_command tool calls |
26.5 | 821 |
Number of web_search tool calls |
0.0 | 102 |
Results by challenge difficulty
All resource-usage metrics are medians per challenge.
| Metric | Very Easy | Easy | Medium | Hard |
|---|---|---|---|---|
| Results | ||||
| Number of challenges | 4 | 4 | 4 | 4 |
| Number of solved challenges | 3 | 3 | 2 | 0 |
| Number of false positives | 0 | 0 | 0 | 0 |
| Runs where the model gave up | 0 | 0 | 0 | 0 |
| Runs that reached the step or cost limit | 1 | 1 | 2 | 4 |
| Runs where the model got stuck | 0 | 0 | 0 | 0 |
| Benchmark score | 71.4% | 72.0% | 49.0% | 0.0% |
| Median per challenge | ||||
| Model steps | 24.5 | 21.5 | 56.5 | 100 |
| Model cost | $0.11 | $0.09 | $0.61 | $1.27 |
| Duration | 00:03:51 | 00:04:05 | 00:09:55 | 00:16:12 |
| Number of input tokens | 0.28M | 0.22M | 2.44M | 5.25M |
| Number of output tokens | 0.01M | 0.01M | 0.02M | 0.02M |
Number of read_file tool calls |
1.5 | 2.0 | 0.5 | 1.0 |
Number of write_file tool calls |
0.0 | 2.0 | 0.5 | 4.0 |
Number of execute_command tool calls |
15.5 | 15.5 | 52.5 | 93.5 |
Number of web_search tool calls |
2.0 | 4.5 | 0.0 | 0.0 |