
Evaluating GLM 5.3 on Hack The Box Challenges
The GLM 5.3 model was released just last week. The interesting fact is that it’s just a retrained version of GLM 5.2, which doesn’t give you much hope for good results. But Z.ai’s marketing gave us sentences like: “As we scaled post-training, cyber capability developed faster than we expected.” and graphs showing better results in CyberGym than both Mythos 5 and GPT-5.6 Sol.
Also, the last model I tested from Z.ai was GLM 5.1, and it was excellent. So I thought: “OK, maybe, just maybe, this time the marketing isn’t overhyped. Maybe I really can get a new open-weight champion…” Well, spoiler alert: I didn’t.
This blog post is part of a series of tests for the HTB-Challenger BenchmarkThe HTB-Challenger Benchmark evaluates LLMs’ ability to find and exploit security vulnerabilities. It tests models against selected Hack The Box challenges of varying difficulty and measures their performance. For more information, visit the HTB-Challenger Benchmark page. . See the benchmark results page for all results and the benchmark methodology to learn how the benchmark is calculated.

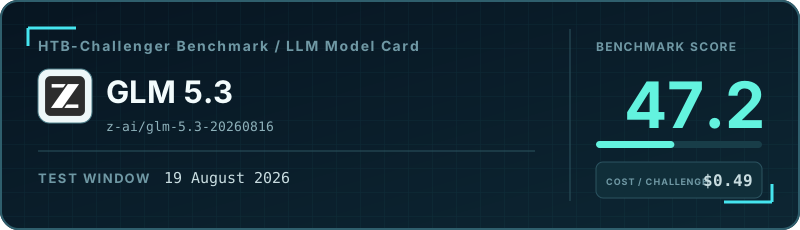
I tested GLM 5.3 for my HTB-Challenger BenchmarkThe HTB-Challenger Benchmark evaluates LLMs’ ability to find and exploit security vulnerabilities. It tests models against selected Hack The Box challenges of varying difficulty and measures their performance. For more information, visit the HTB-Challenger Benchmark page. , and it landed on the Cost vs. Benchmark Score chart right next to Muse Spark 1.2 from the company-who-must-not-be-named, and that’s not a good neighborhood. It basically means that its results were mediocre while the price per task was high.
To explain these results, we don’t need to look too far. If you read the Emergent Cyber Capability section in the GLM 5.3 release notes carefully - and thanks to this article for bringing it to my attention - you’ll see that it scored very well on CyberBench, which measures how good the model is at finding vulnerabilities, but much worse on ExploitBench and ExploitGym, which measure a model’s ability to create working exploits. In other words, GLM 5.3 may be quite good at finding security issues, but it’s not very good at exploiting them, especially when you give it a time limit.
And that explains the poor results in my benchmark very well. I test each model on Hack The Box challenges, and succeeding in each challenge requires not only finding the vulnerability but also exploiting it. On top of that, each model has only a limited number of steps per test.
You may think that exploitation skills are not important if you want to use the model only for finding vulnerabilities, but I would disagree. The thing is that even when you’re just finding vulnerabilities, you still need a quick way to validate them and rule out false positives. The best way is to do this automatically. Your security testing harness could ask the model to actually try exploiting each discovered vulnerability to verify that it’s real. And if that’s not possible, you need the model to create at least a proof of concept - step-by-step instructions on how to exploit the vulnerability, ideally wrapped in a script or Python code. For both of these verification methods, you need the model to have good exploitation skills.
So, unfortunately, there’s nothing to see here. GLM 5.3 is not the next big thing for cybersecurity tasks.
Cost vs. Benchmark Score
The highlighted point is this model. Models closer to the upper-left achieve a higher benchmark score at a lower median cost per challenge.
Overall benchmark results
- Number of challenges: 16
- Number of solved challenges: 10
- Number of false positives: 0
- Runs where the model gave up: 0
- Runs that reached the step or cost limit: 3
- Runs where the model got stuck: 3
- Benchmark score: 47.2%
| Metric | Per challenge (median) | Total |
|---|---|---|
| Model steps | 16.5 | 609 |
| Model cost | $0.49 | $11.15 |
| Duration | 00:11:52 | 05:55:55 |
| Number of input tokens | 0.24M | 18.36M |
| Number of output tokens | 0.02M | 1.13M |
Number of read_file tool calls |
0.5 | 32 |
Number of write_file tool calls |
1.0 | 37 |
Number of execute_command tool calls |
18.5 | 653 |
Number of web_search tool calls |
0.0 | 3 |
Results by challenge difficulty
All resource-usage metrics are medians per challenge.
| Metric | Very Easy | Easy | Medium | Hard |
|---|---|---|---|---|
| Results | ||||
| Number of challenges | 4 | 4 | 4 | 4 |
| Number of solved challenges | 4 | 3 | 2 | 1 |
| Number of false positives | 0 | 0 | 0 | 0 |
| Runs where the model gave up | 0 | 0 | 0 | 0 |
| Runs that reached the step or cost limit | 0 | 1 | 1 | 1 |
| Runs where the model got stuck | 0 | 0 | 1 | 2 |
| Benchmark score | 90.9% | 69.0% | 48.8% | 24.2% |
| Median per challenge | ||||
| Model steps | 19 | 41 | 13.5 | 20 |
| Model cost | $0.19 | $0.63 | $0.46 | $0.88 |
| Duration | 00:05:47 | 00:39:48 | 00:14:35 | 00:23:33 |
| Number of input tokens | 0.16M | 0.43M | 0.22M | 0.35M |
| Number of output tokens | 0.02M | 0.10M | 0.03M | 0.08M |
Number of read_file tool calls |
0.5 | 3.0 | 0.0 | 1.0 |
Number of write_file tool calls |
0.0 | 6.0 | 1.0 | 0.5 |
Number of execute_command tool calls |
17.0 | 29.5 | 16.0 | 28.5 |
Number of web_search tool calls |
0.0 | 0.5 | 0.0 | 0.0 |