
Evaluating Pareto on Hack The Box Challenges
Have you ever heard of Unbiased AI or the Pareto model that they are working on? Me neither. That’s why I was quite surprised when this model performed very well in my testing. And I was even more surprised when I found out that Unbiased AI is not an LLM-making company and that Pareto is not actually an LLM.
This blog post is part of a series of tests for the HTB-Challenger BenchmarkThe HTB-Challenger Benchmark evaluates LLMs’ ability to find and exploit security vulnerabilities. It tests models against selected Hack The Box challenges of varying difficulty and measures their performance. For more information, visit the HTB-Challenger Benchmark page. . See the benchmark results page for all results and the benchmark methodology to learn how the benchmark is calculated.
Let’s clear things up a bit: Pareto is a “blended AI model”. You can read about how it works in this article, but basically Pareto is just a facade for a platform consisting of multiple (undisclosed) LLMs. You send it a message, it is processed by a few LLMs, their answers are aggregated, and the result is sent back to you. This is not a new concept; for example, OpenRouter introduced a similar Fusion “model” some time ago, but I haven’t tested it yet.
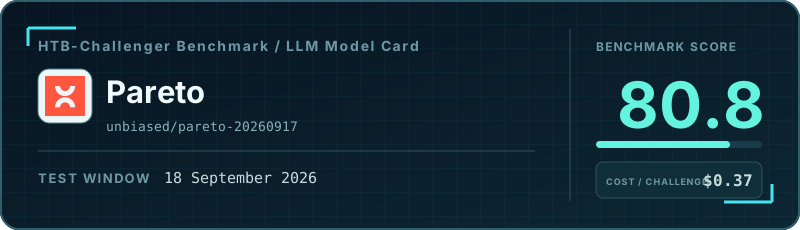
My verdict based on this testing is this: in terms of performance, Pareto is excellent at cracking Hack The Box challenges and achieved a score of 80.8% in my benchmark. It’s not as good as GPT-5.6 Sol, which scored 87.2%, but it’s on the same level as GLM 5.3 Flash (81.0%) and DeepSeek V4.1 Flash (80.9%).
Its only issue is that it’s relatively expensive. Its median cost per challenge was $0.37, which is not only MUCH higher than GLM 5.3 Flash ($0.01) and DeepSeek V4.1 Flash ($0.05), but also higher than GPT-5.6 Sol ($0.29).
So, good job on the performance, Unbiased AI, but now you need to fire a few managers and janitors to make your company more cost-effective.
Cost vs. Benchmark Score
The highlighted point is this model. Models closer to the upper-left achieve a higher benchmark score at a lower median cost per challenge.
Overall benchmark results
- Number of challenges: 16
- Number of solved challenges: 15
- Number of false positives: 0
- Runs where the model gave up: 1
- Runs that reached the step or cost limit: 0
- Runs where the model got stuck: 0
- Benchmark score: 80.8%
| Metric | Per challenge (median) | Total |
|---|---|---|
| Model steps | 25.5 | 555 |
| Model cost | $0.37 | $21.43 |
| Duration | 00:08:22 | 03:32:18 |
| Number of input tokens | 0.34M | 17.50M |
| Number of output tokens | 0.02M | 1.70M |
Number of read_file tool calls |
1.0 | 31 |
Number of write_file tool calls |
4.0 | 90 |
Number of execute_command tool calls |
23.5 | 592 |
Number of web_search tool calls |
0.0 | 1 |
Results by challenge difficulty
All resource-usage metrics are medians per challenge.
| Metric | Very Easy | Easy | Medium | Hard |
|---|---|---|---|---|
| Results | ||||
| Number of challenges | 4 | 4 | 4 | 4 |
| Number of solved challenges | 4 | 4 | 4 | 3 |
| Number of false positives | 0 | 0 | 0 | 0 |
| Runs where the model gave up | 0 | 0 | 0 | 1 |
| Runs that reached the step or cost limit | 0 | 0 | 0 | 0 |
| Runs where the model got stuck | 0 | 0 | 0 | 0 |
| Benchmark score | 95.9% | 92.0% | 91.2% | 63.6% |
| Median per challenge | ||||
| Model steps | 14.5 | 23 | 29 | 52 |
| Model cost | $0.20 | $0.26 | $1.04 | $2.52 |
| Duration | 00:01:57 | 00:06:18 | 00:11:29 | 00:22:28 |
| Number of input tokens | 0.14M | 0.19M | 1.12M | 1.79M |
| Number of output tokens | 0.01M | 0.02M | 0.07M | 0.19M |
Number of read_file tool calls |
0.5 | 1.0 | 0.5 | 1.5 |
Number of write_file tool calls |
1.0 | 6.0 | 4.0 | 7.5 |
Number of execute_command tool calls |
12.5 | 17.0 | 28.0 | 51.0 |
Number of web_search tool calls |
0.0 | 0.0 | 0.0 | 0.0 |