
Evaluating DeepSeek V4.1 Flash on Hack The Box Challenges
DeepSeek V4 has been a strange story for me. The original Flash model impressed me in my Strix tests back in April, but V4 Flash 0731 then gave me one of the most disappointing results in this benchmark. The original V4 Pro and updated Pro 0813 did better, but neither got close to the leaders. So I was curious whether DeepSeek V4.1 Flash would finally change that.
It did. DeepSeek is back.
This blog post is part of a series of tests for the HTB-Challenger BenchmarkThe HTB-Challenger Benchmark evaluates LLMs’ ability to find and exploit security vulnerabilities. It tests models against selected Hack The Box challenges of varying difficulty and measures their performance. For more information, visit the HTB-Challenger Benchmark page. . See the benchmark results page for all results and the benchmark methodology to learn how the benchmark is calculated.
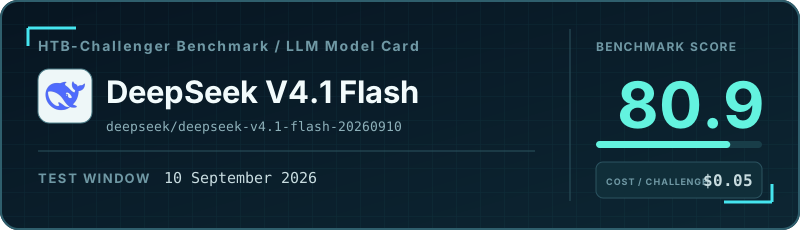
V4.1 Flash solved 15 out of 16 challenges, including three of the four Hard ones. Just as importantly, it didn’t repeat the previous Flash model’s habit of submitting incorrect flags. This is the DeepSeek result I had been waiting for.
Not quite a new champion, though. GPT-5.6 Sol still scored higher and needed far fewer steps, although it costs more. GLM 5.3 Flash solved exactly the same challenges as V4.1 Flash at a lower median cost. Their scores were practically identical, and I wouldn’t read too much into such a small gap.
It is easily the strongest DeepSeek run I’ve seen on this benchmark. If I want strong autonomous problem-solving without paying Sol prices, V4.1 Flash is finally a DeepSeek model I can seriously consider again.
Cost vs. Benchmark Score
The highlighted point is this model. Models closer to the upper-left achieve a higher benchmark score at a lower median cost per challenge.
Overall benchmark results
- Number of challenges: 16
- Number of solved challenges: 15
- Number of false positives: 0
- Runs where the model gave up: 0
- Runs that reached the step or cost limit: 0
- Runs where the model got stuck: 1
- Benchmark score: 80.9%
| Metric | Per challenge (median) | Total |
|---|---|---|
| Model steps | 26 | 537 |
| Model cost | $0.05 | $1.25 |
| Duration | 00:07:50 | 03:08:24 |
| Number of input tokens | 0.90M | 17.98M |
| Number of output tokens | 0.05M | 1.36M |
Number of read_file tool calls |
1.0 | 69 |
Number of write_file tool calls |
2.0 | 59 |
Number of execute_command tool calls |
27.5 | 564 |
Number of web_search tool calls |
0.0 | 10 |
Results by challenge difficulty
All resource-usage metrics are medians per challenge.
| Metric | Very Easy | Easy | Medium | Hard |
|---|---|---|---|---|
| Results | ||||
| Number of challenges | 4 | 4 | 4 | 4 |
| Number of solved challenges | 4 | 4 | 4 | 3 |
| Number of false positives | 0 | 0 | 0 | 0 |
| Runs where the model gave up | 0 | 0 | 0 | 0 |
| Runs that reached the step or cost limit | 0 | 0 | 0 | 0 |
| Runs where the model got stuck | 0 | 0 | 0 | 1 |
| Benchmark score | 95.5% | 90.0% | 88.0% | 67.4% |
| Median per challenge | ||||
| Model steps | 17.5 | 27.5 | 34 | 26 |
| Model cost | $0.01 | $0.03 | $0.05 | $0.10 |
| Duration | 00:01:31 | 00:08:37 | 00:08:50 | 00:12:45 |
| Number of input tokens | 0.41M | 0.70M | 1.31M | 1.03M |
| Number of output tokens | 0.01M | 0.04M | 0.04M | 0.09M |
Number of read_file tool calls |
0.5 | 1.0 | 0.5 | 4.0 |
Number of write_file tool calls |
0.5 | 3.0 | 4.0 | 2.0 |
Number of execute_command tool calls |
18.0 | 17.5 | 33.5 | 30.0 |
Number of web_search tool calls |
0.0 | 0.0 | 0.0 | 0.0 |