
Evaluating Qwen3.8 Max on Hack The Box Challenges
Qwen3.8 Max was released recently, but it didn’t create much buzz. I was wondering if it was simply overshadowed by Kimi K3, which was released just a few days earlier, or if its performance wasn’t strong enough to raise any eyebrows.
This blog post is part of a series of tests for the HTB-Challenger BenchmarkThe HTB-Challenger Benchmark evaluates LLMs’ ability to find and exploit security vulnerabilities. It tests models against selected Hack The Box challenges of varying difficulty and measures their performance. For more information, visit the HTB-Challenger Benchmark page. . See the benchmark results page for all results and the benchmark methodology to learn how the benchmark is calculated.
I know this model has a relatively big fan base among software developers, but based on my results, I bet it won’t win many fans among pentesters and red teamers.
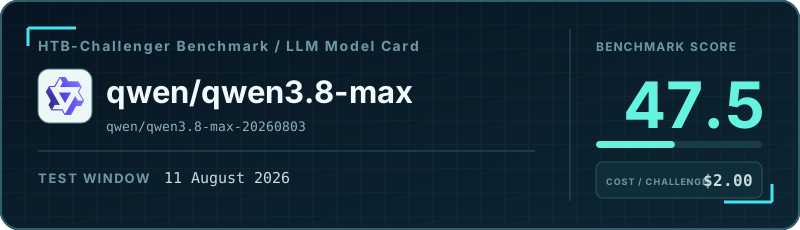
Put simply, it’s by far the most expensive model I’ve tested so far, while its results are only mediocre. It solved 10 of 16 challenges and scored 62.7%. For comparison, GPT 5.6 Luna Pro scored a similar 51.3%, but its median cost per challenge was only $0.10 - one-twentieth of Qwen3.8 Max’s $2.00.
Of course, this benchmark covers self-contained HTB challenges, not full pentests or red-team engagements. Still, the price-to-performance ratio for this kind of offensive security task is hard to justify.
I’m really not sure what the use case for this model is. If you already use it for coding and are happy with it, you can also try it on CTF-style offensive security tasks. It solved six of the eight Very Easy and Easy challenges, so the results there were pretty good. But if cost matters or you need better performance on harder challenges, there are better options available.
Cost vs. Benchmark Score
The highlighted point is this model. Models closer to the upper-left achieve a higher benchmark score at a lower median cost per challenge.
Overall benchmark results
- Number of challenges: 16
- Number of solved challenges: 12
- Number of false positives: 0
- Runs where the model gave up: 0
- Runs that reached the step or cost limit: 4
- Runs where the model got stuck: 0
- Benchmark score: 62.7%
| Metric | Per challenge (median) | Total |
|---|---|---|
| Model steps | 29 | 702 |
| Model cost | $2.00 | $55.77 |
| Duration | 00:16:02 | 07:32:36 |
| Number of input tokens | 0.93M | 26.08M |
| Number of output tokens | 0.03M | 1.19M |
Number of read_file tool calls |
1.0 | 69 |
Number of write_file tool calls |
3.0 | 80 |
Number of execute_command tool calls |
25.5 | 643 |
Number of web_search tool calls |
0.0 | 8 |
Results by challenge difficulty
All resource-usage metrics are medians per challenge.
| Metric | Very Easy | Easy | Medium | Hard |
|---|---|---|---|---|
| Results | ||||
| Number of challenges | 4 | 4 | 4 | 4 |
| Number of solved challenges | 4 | 3 | 3 | 2 |
| Number of false positives | 0 | 0 | 0 | 0 |
| Runs where the model gave up | 0 | 0 | 0 | 0 |
| Runs that reached the step or cost limit | 0 | 1 | 1 | 2 |
| Runs where the model got stuck | 0 | 0 | 0 | 0 |
| Benchmark score | 95.6% | 71.1% | 68.1% | 46.2% |
| Median per challenge | ||||
| Model steps | 16 | 27.5 | 47 | 65.5 |
| Model cost | $0.34 | $1.50 | $3.44 | $5.87 |
| Duration | 00:04:16 | 00:13:24 | 00:31:30 | 00:27:00 |
| Number of input tokens | 0.18M | 0.74M | 1.28M | 3.00M |
| Number of output tokens | 0.01M | 0.03M | 0.09M | 0.06M |
Number of read_file tool calls |
0.5 | 1.0 | 1.5 | 4.0 |
Number of write_file tool calls |
0.5 | 4.5 | 2.5 | 5.5 |
Number of execute_command tool calls |
12.5 | 21.5 | 40.0 | 60.0 |
Number of web_search tool calls |
0.0 | 1.0 | 0.0 | 0.0 |