
Evaluating Hy3 on Hack The Box Challenges
Tencent’s Hy3 belongs to the category of “interesting LLM models you may never have heard of.” It appeared to be quite popular on OpenRouter.ai at the start of the summer, when a free version was available, and it seemed to have earned a good reputation. So I thought it might be worth including in the HTB-Challenger BenchmarkThe HTB-Challenger Benchmark evaluates LLMs’ ability to find and exploit security vulnerabilities. It tests models against selected Hack The Box challenges of varying difficulty and measures their performance. For more information, visit the HTB-Challenger Benchmark page. .
This blog post is part of a series of tests for the HTB-Challenger BenchmarkThe HTB-Challenger Benchmark evaluates LLMs’ ability to find and exploit security vulnerabilities. It tests models against selected Hack The Box challenges of varying difficulty and measures their performance. For more information, visit the HTB-Challenger Benchmark page. . See the benchmark results page for all results and the benchmark methodology to learn how the benchmark is calculated.

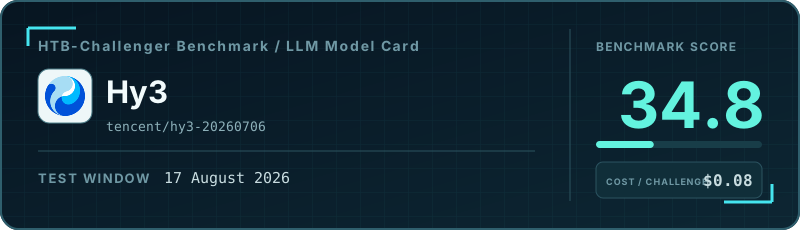
In the end, I was a bit disappointed. In terms of performance, Hy3 sits near the bottom of my benchmark score ladder: its 34.8% score was the third-lowest among the all tested models. In terms of cost, it’s cheap, but not exceptionally so: its median cost per challenge was more than four times that of GPT-5.6 Luna, which achieved a similar benchmark score.
The biggest issue with this model was that it got stuck on more than half of the tested challenges. In these runs, it started producing long, repetitive reasoning outputs in which it argued with itself about potential solutions, and it did not recover after the test harness asked it to shorten its response. Nine of its 16 runs ended this way.
The same behavior is visible in the output-token statistics. Hy3 generated more output than any other model. Its median was 101,509 output tokens per challenge, about 51% above the next-highest model, GPT-5.6 Luna Pro, at 67,298. Its total of 1.79 million output tokens was also the highest overall. Its output-to-input ratio was an extreme outlier: output tokens equaled 11.72% of input tokens across the run, while the next-highest model, Qwen3.8 Max, reached only 4.56%. These figures are consistent with the repetitive responses visible in the run logs.
In summary, this model may have valid use cases, but cybersecurity is not one of them.
Cost vs. Benchmark Score
The highlighted point is this model. Models closer to the upper-left achieve a higher benchmark score at a lower median cost per challenge.
Overall benchmark results
- Number of challenges: 16
- Number of solved challenges: 6
- Number of false positives: 0
- Runs where the model gave up: 0
- Runs that reached the step or cost limit: 1
- Runs where the model got stuck: 9
- Benchmark score: 34.8%
| Metric | Per challenge (median) | Total |
|---|---|---|
| Model steps | 18.5 | 471 |
| Model cost | $0.08 | $1.92 |
| Duration | 00:15:21 | 04:41:55 |
| Number of input tokens | 0.32M | 15.25M |
| Number of output tokens | 0.10M | 1.79M |
Number of read_file tool calls |
1.5 | 73 |
Number of write_file tool calls |
0.5 | 44 |
Number of execute_command tool calls |
10.5 | 400 |
Number of web_search tool calls |
0.0 | 5 |
Results by challenge difficulty
All resource-usage metrics are medians per challenge.
| Metric | Very Easy | Easy | Medium | Hard |
|---|---|---|---|---|
| Results | ||||
| Number of challenges | 4 | 4 | 4 | 4 |
| Number of solved challenges | 1 | 2 | 2 | 1 |
| Number of false positives | 0 | 0 | 0 | 0 |
| Runs where the model gave up | 0 | 0 | 0 | 0 |
| Runs that reached the step or cost limit | 1 | 0 | 0 | 0 |
| Runs where the model got stuck | 2 | 2 | 2 | 3 |
| Benchmark score | 24.9% | 49.4% | 48.1% | 20.0% |
| Median per challenge | ||||
| Model steps | 10.5 | 10.5 | 38 | 42 |
| Model cost | $0.06 | $0.06 | $0.18 | $0.18 |
| Duration | 00:12:16 | 00:17:03 | 00:15:24 | 00:18:06 |
| Number of input tokens | 0.15M | 0.14M | 1.22M | 1.37M |
| Number of output tokens | 0.08M | 0.08M | 0.14M | 0.12M |
Number of read_file tool calls |
1.0 | 3.0 | 1.0 | 4.0 |
Number of write_file tool calls |
3.0 | 0.0 | 3.5 | 0.5 |
Number of execute_command tool calls |
7.5 | 7.0 | 23.5 | 48.0 |
Number of web_search tool calls |
0.0 | 0.0 | 0.0 | 0.0 |