
Evaluating Muse Spark 1.3 on Hack The Box Challenges
The company-who-must-not-be-named released a new version of its Muse Spark model - Muse Spark 1.3. The announcement claims that this model should be more suitable for long-horizon tasks and should use approximately 20% fewer tool calls and 25% fewer tokens than Muse Spark 1.2. I tested the 1.2 version a few weeks ago, and I found it forgettable. So I was curious whether a gap of just one month between the two model releases could make any difference.
This blog post is part of a series of tests for the HTB-Challenger BenchmarkThe HTB-Challenger Benchmark evaluates LLMs’ ability to find and exploit security vulnerabilities. It tests models against selected Hack The Box challenges of varying difficulty and measures their performance. For more information, visit the HTB-Challenger Benchmark page. . See the benchmark results page for all results and the benchmark methodology to learn how the benchmark is calculated.
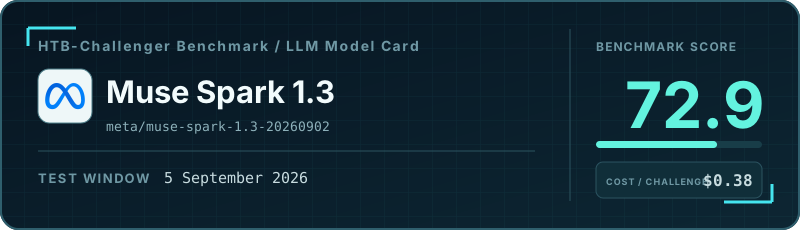
Surprisingly, it turns out that you can do a lot in four weeks in terms of improving an LLM for solving HTB challenges. The new version achieved a much better score than its predecessor: 72.93% versus 50.41%. Its score is in the same range as those of Kimi K3 (70.67%) and Grok 4.6 (76.14%), both of which are great models.
The only issue is the median cost per challenge, which is better than the previous version ($0.476 vs $0.385), but still relatively high. You can use GPT-5.6 Sol, which has a much better benchmark score and a slightly lower cost (87.2% / $0.29), or my favorite, GLM 5.3 Flash, with a slightly higher score and a much lower cost (81.0% / $0.01).
So the new Muse Spark 1.3 is not bad at all, but I don’t see any reason to switch to it from GPT-5.6 Sol or GLM 5.3 Flash.
Cost vs. Benchmark Score
The highlighted point is this model. Models closer to the upper-left achieve a higher benchmark score at a lower median cost per challenge.
Overall benchmark results
- Number of challenges: 16
- Number of solved challenges: 14
- Number of false positives: 0
- Runs where the model gave up: 1
- Runs that reached the step or cost limit: 1
- Runs where the model got stuck: 0
- Benchmark score: 72.9%
| Metric | Per challenge (median) | Total |
|---|---|---|
| Model steps | 23 | 608 |
| Model cost | $0.38 | $13.64 |
| Duration | 00:08:05 | 02:41:53 |
| Number of input tokens | 0.60M | 23.44M |
| Number of output tokens | 0.02M | 0.58M |
Number of read_file tool calls |
1.0 | 64 |
Number of write_file tool calls |
0.0 | 15 |
Number of execute_command tool calls |
19.5 | 524 |
Number of web_search tool calls |
0.5 | 25 |
Results by challenge difficulty
All resource-usage metrics are medians per challenge.
| Metric | Very Easy | Easy | Medium | Hard |
|---|---|---|---|---|
| Results | ||||
| Number of challenges | 4 | 4 | 4 | 4 |
| Number of solved challenges | 4 | 4 | 4 | 2 |
| Number of false positives | 0 | 0 | 0 | 0 |
| Runs where the model gave up | 0 | 0 | 0 | 1 |
| Runs that reached the step or cost limit | 0 | 0 | 0 | 1 |
| Runs where the model got stuck | 0 | 0 | 0 | 0 |
| Benchmark score | 93.7% | 97.8% | 88.4% | 43.7% |
| Median per challenge | ||||
| Model steps | 18 | 11.5 | 42 | 73.5 |
| Model cost | $0.17 | $0.11 | $0.98 | $1.87 |
| Duration | 00:02:02 | 00:04:01 | 00:10:46 | 00:17:39 |
| Number of input tokens | 0.32M | 0.12M | 1.58M | 3.18M |
| Number of output tokens | 0.01M | 0.01M | 0.04M | 0.06M |
Number of read_file tool calls |
0.5 | 1.0 | 2.0 | 3.5 |
Number of write_file tool calls |
0.0 | 0.0 | 0.0 | 0.5 |
Number of execute_command tool calls |
13.5 | 8.0 | 39.0 | 61.5 |
Number of web_search tool calls |
0.5 | 1.5 | 0.0 | 2.5 |